
Will BJP struggle to secure clear majority in 2019 Elections ?

BJP (Bharatiya Janata Party) got an astounding victory with majority (282 seats) in Lok Sabha 2014 elections (Parliamentary Elections )of India. This was an unprecedented victory of any political party in India in the last 30 years or so. Indian Parliamentary elections (also known as Lok Sabha elections) has 543 seats that go for public voting. Among the total seats, any party has to secure at least 272 seats (either on its own or by forming alliance with other parties) to win the elections. The winner gets the chance to form the government and rule the country for next 5 year term (at most).
I have tried to analyse the voting results conducted in 543 constituencies across the country during the Lok Sabha 2014 elections. I did it to assess or derive whether BJP will be able to repeat the voting patterns of 2014 and win the 2019 elections comfortably by securing the majority (at least 272 seats).
To achieve the objectives, this article analyses the data to derive the following :
-
Voter turnout ratio to find voting patterns across states in India which is demonstrated as consistent.
-
Percentage of vote share obtained by BJP to its voting margins in each constituency to demonstrate all states are not voting equally for BJP.
-
Normalise the BJP’s vote margin to get a normal distribution curve and to find the outlier states on either side to find the guaranteed wins and losses for BJP.
-
With various confidence levels, this article tries to find the confidence interval where it can be shown if BJP is able to win the majority or not.
Unfortunately, it seems BJP will struggle to get the majority and it will not be a smooth ride for BJP in 2019 Lok Sabha Elections.
This article considers the data only from the vote margins perspective for each constituency. The dataset considered has been explained in the next section. The input dataset and the resultant calculations can be downloaded from the below given links. elections-2019.xlsx
The complete Data set : https://www.dropbox.com/s/thp0c15wvxoh5fz/elections-2019.zip?dl=0
There are many other factors that go in predicting elections but are not considered in this article. For example : BJP’s performance being in government since 2014, country’s economic conditions, political climate, state elections wins and losses, public sentiment, demonetisation etc.
Explaining the Dataset
The data has been obtained from the Election Commission of India website and the link for the same is http://eci.nic.in/eci_main1/ElectionStatistics.aspx .
The master dataset contains the voting data from 2014 Lok Sabha Elections. This is the total population data for 508 constituencies out of 543 constituencies. This data was cross matched against 8355 records of all valid nominations of candidates in each constituency to calculate winning candidate and his/her margin along with the next trailing candidate along with vote share. Also, the data considers the number of total electors, total voters, gender based votes, postal votes, BJP’s winning and losing margins etc.
In this analysis, I considered the vote share of BJP as 0 (Zero) if BJP did not field any candidate from particular constituency and similarly, the vote margin is marked as -100%. The negative voting margin indicates BJP lost the seat while positive voting margin indicates the win. But to calculate normal distribution curve of BJP’s voting margins, the seats where BJP’s vote share is 0% is not considered as they did not field any candidate in that constituency.
The Voter Turnout
The average voting turnout in Lok Sabha 2014 Elections was 71.26% with an standard deviation of 9.32%. The median voting turnout was 71.42%.
Following graph indicates the voter turnout in each state and also, outlines the male voters, female voter turnout state-wise. This graph also outlines the voter turnout in each state as a percentage of national voter turnout. This helps in identifying the states that make an impact on the election results in a significant manner.
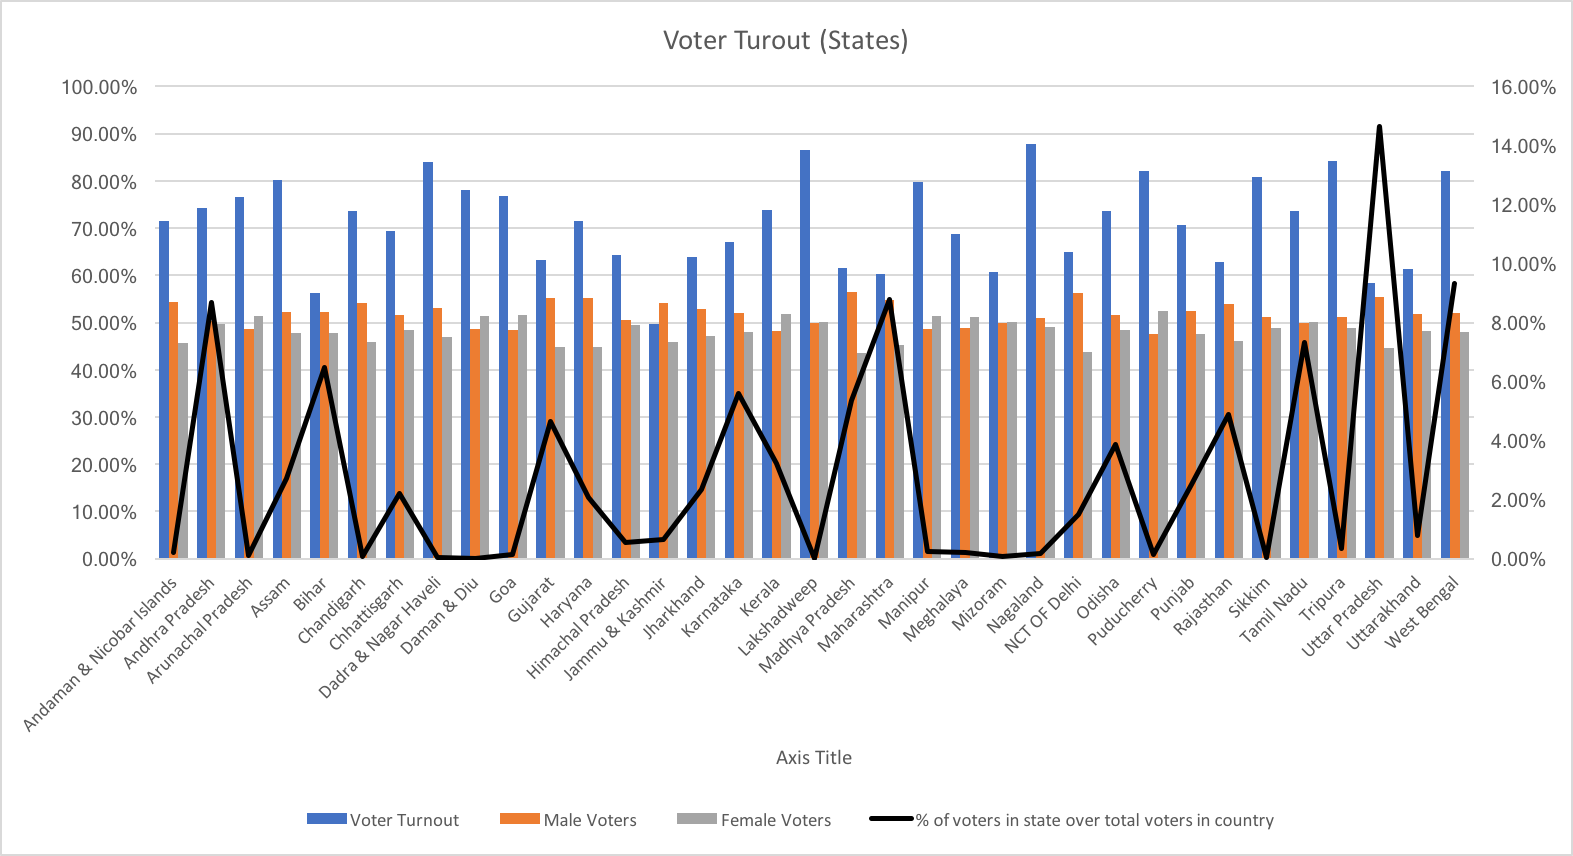
On closely analysing this graph, it figures that states like Uttar Pradesh, Maharashtra, Karnataka, Gujarat, Andhra Pradesh, Bihar, Odisha, Rajasthan, Tamil Nadu and West Bengal play a significant role in deciding the election results as they form the highest percentage of Voter turnout with respect to national voter turnout.
Out of these significant states, West Bengal and Tamil Nadu are not at all aligned to BJP. Even Andhra Pradesh is not so much favourable to BJP (whether it’s pre-poll or post poll alliance). Karnataka also has shown the tough fight given to BJP by JD(S) and Congress alliance in 2018 state elections.
Thus, It is in interest of any political party (whether BJP or any other party) to gain a significant number of seats in these states as voting in these states decide the fate of the party due to its sheer volume of vote share.
BJP Vote Share to BJP Vote Margin
To find the BJP’s strength to win elections in 2019 with majority, it is important to understand their vote share and winning margins in 2014 elections where they performed very well and went on to win 282 seats in total.
As we consider only 508 constituencies in this article, BJP won 268 out of the analysed 508 seats. There were 21 seats BJP won with less than 5% margin. This means there were at least 21 seats where BJP struggled but managed to win. And these 21 seats will provide a tough fight again in 2019 elections. Thus, BJP should give a special focus on these 21 seats to achieve the majority.
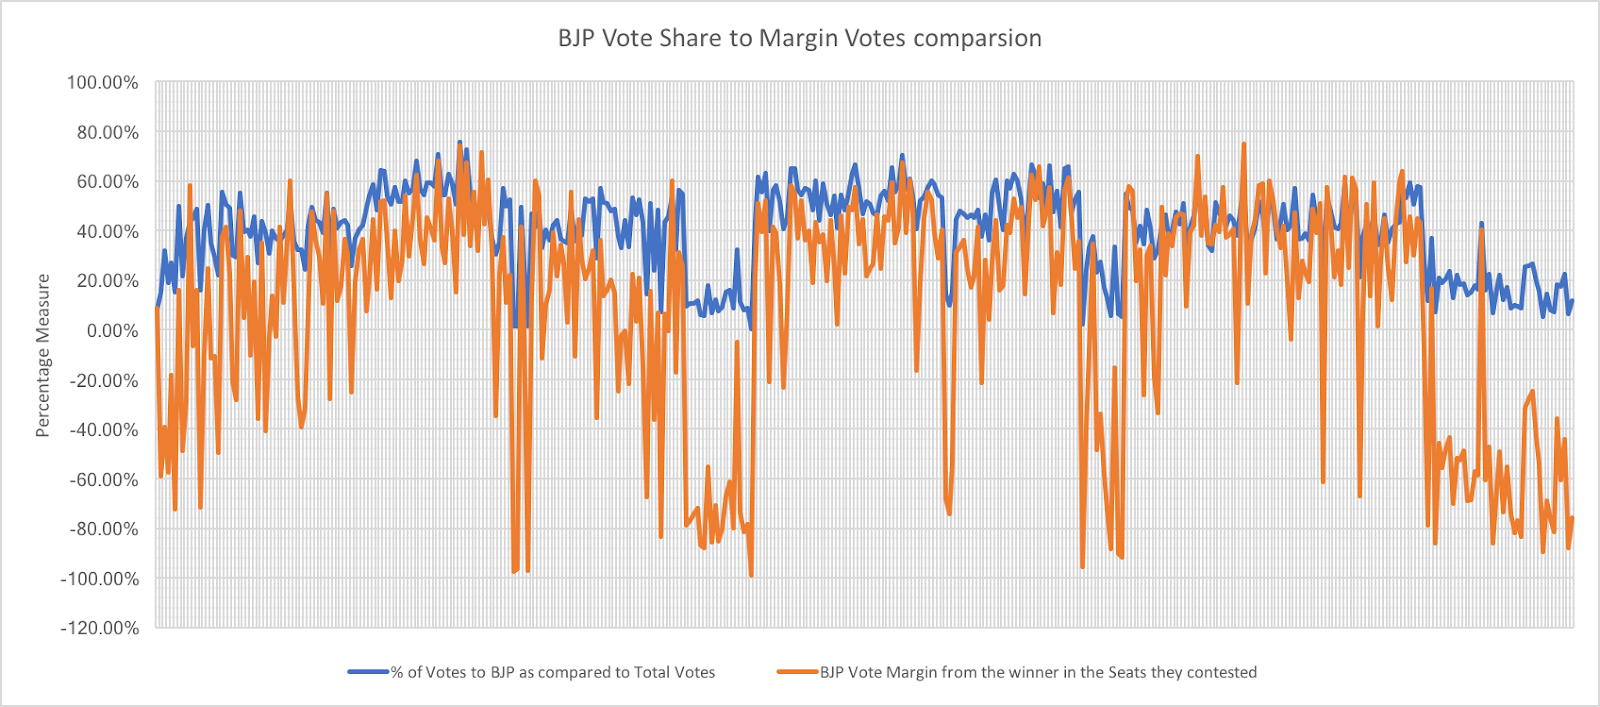
The above graph proves the point BJP had a very close contest in many of the constituencies where vote share and margin is almost similar. The huge negative difference between vote share and margin depicts that these seats are the losing seats and the gap is too huge to fill and should not be focussed upon as the voters may not be favouring BJP under any circumstances.
Finding the outliers
I decided to find the outlier states where BJP is guaranteed to win or lose. To do the same, I normalised the BJP’s winning margin percentage in each constituency by calculating its Z score.
To calculate the Z Score, I applied the formula
Z Score = ( Value — Mean ) / Standard Deviation.
Using the Z Score, I derived the probability density value (value for normal distribution) to plot the following normal distribution curve.
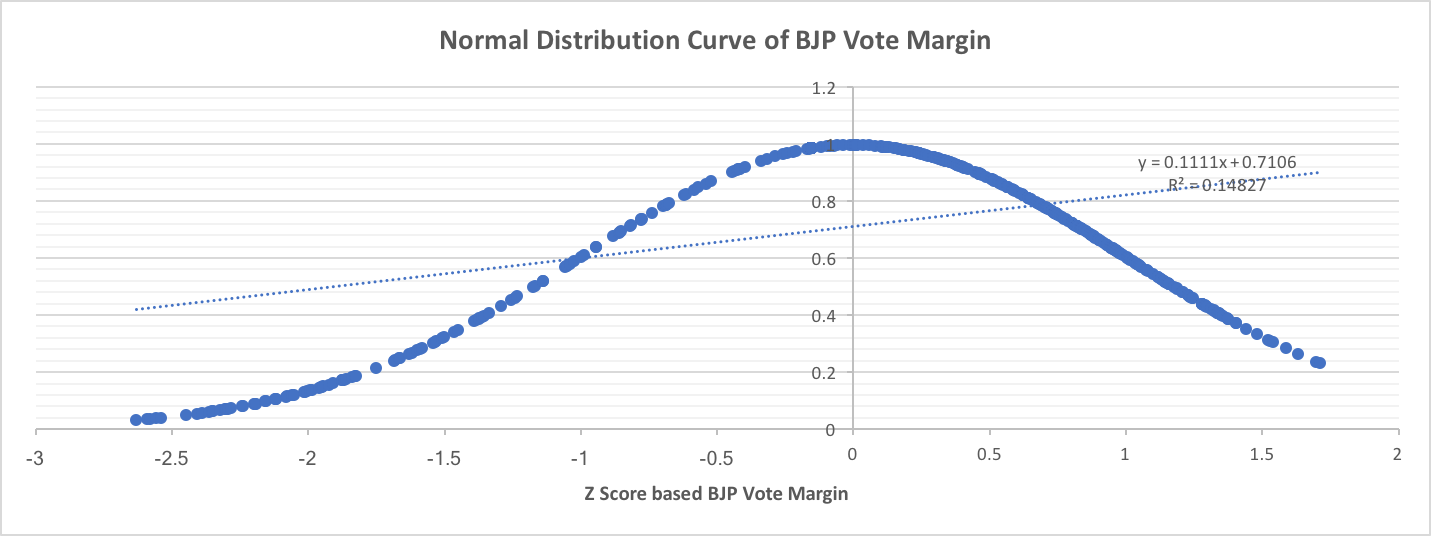
Also, I calculated the interquartile range (IQR) of BJP’s winning margin percentage. The upper fence of the same is 95.88% which means the highest winning margin in a particular constituency. And the lower fence is -57.33% which is the lowest margin where BJP lost the seat.
By applying 2 Standard deviations (each standard deviation is 40.06%), there are 56 losing outliers and 0 winning outliers. This means that there are 56 constituencies where BJP has lost elections with significant margin (beyond 2 standard deviations) and to win these, there is immense focus required. Ideally, winning these seats is practically impossible, BJP should write off these seats from their projection of majority wins. These 56 seats seem to be a guaranteed loss. Also, there seems to be 0 (zero) seats that provide a winning outlier or a guaranteed win. Hence, BJP should focus a lot more on seats with <=1 standard deviation and still a little less on seats > 1 standard deviation as they have still some comfortable position on >1 S.D. seats.
Will BJP be able to retain the majority (272 seats) in 2019 Lok Sabha Elections too ?
To arrive at a decision, I formulated the following NULL hypothesis
Ho = 272 ; Ho = BJP will be able to retain majority (272 seats) in 2019 Lok Sabha elections.
And the alternate hypothesis ,
Ha ≠ 272; Ha = BJP will NOT be able to retain majority (272 seats) in 2019 Lok Sabha elections
And I performed a two tailed test by using the Z value from the normal distribution curve. Also, I used the various confidence levels to find the confidence interval of number of winning seats.
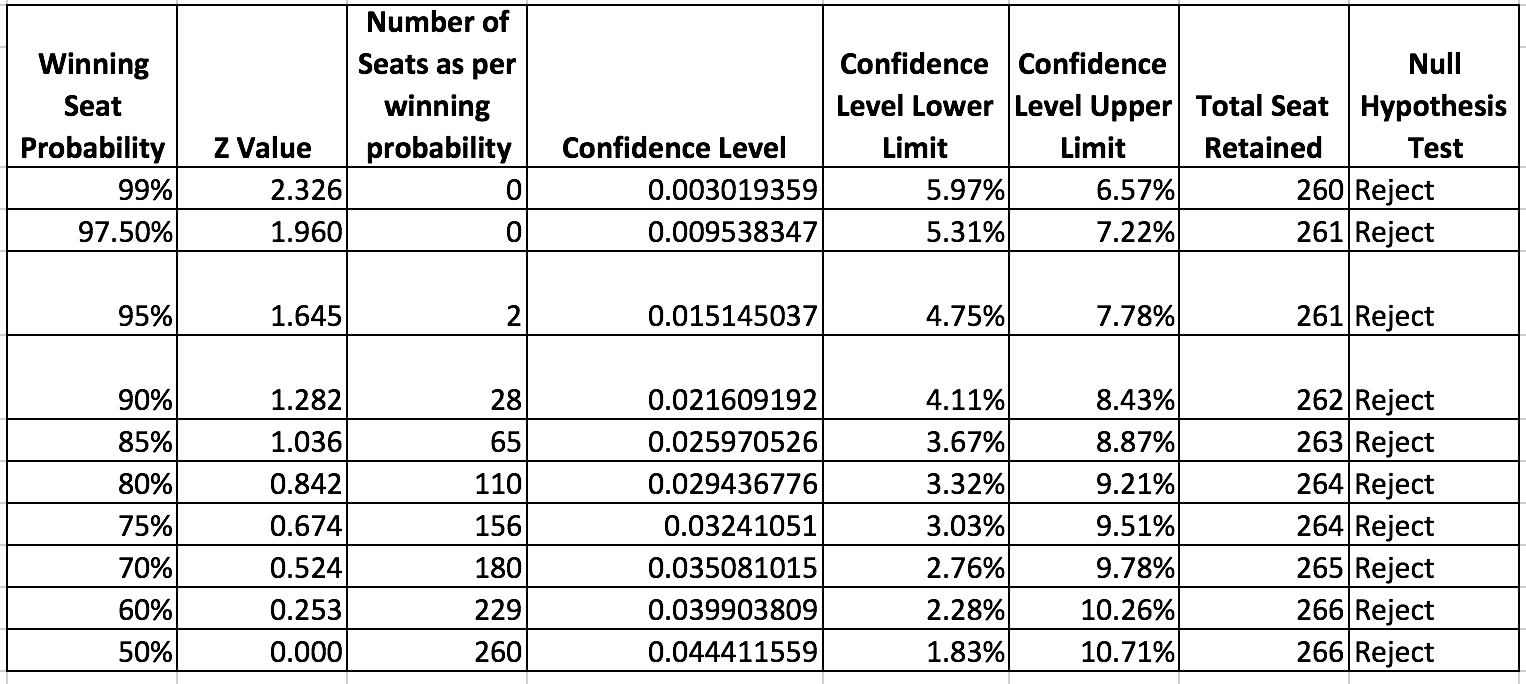
In all possibilities of various confidence levels ranging from 99% to 50%, BJP still seems to win a minimum of 260 seats to a maximum of 266 seats.
Hence, I rejected the NULL hypothesis that BJP can retain the majority (272 seats) in Lok sabha 2019 Elections and accepted the alternate hypothesis.
Conclusion
With this analysis, I can safely derive the assumptions that BJP need to put very significant effort in securing wins even in the constituencies they feel safe and have won in the past. This is due to the fact that out of 282 secured wins in 2014 Lok Sabha elections, there are no guaranteed wins and there are 21 very less margin wins. But out of total 396 constituencies where BJP nominates its candidates, there are guaranteed 56 losses.
So, 2019 Lok Sabha elections is not going to be a cake walk and it seems BJP is going to struggle for majority.
To achieve majority, BJP needs to focus on identified low margin wins and increase their winning margin to safe region of within in 2 standard deviation.
References & Research Calculations :
-
Election Commission of India Website : http://eci.nic.in/eci_main1/ElectionStatistics.aspx
-
All the gathered datasets and worksheets : https://www.dropbox.com/s/thp0c15wvxoh5fz/elections-2019.zip?dl=0
-
Resultant Calculation Workbook : https://www.dropbox.com/s/oal30p88jl4d6jl/elections-2019.xlsx?dl=0